

Monitoring of snow cover, dynamics of snowfall and manifestations of erosive processes in the fields of the SPC GF named after A.I. Barayev in 2023
Главная / News / Main news
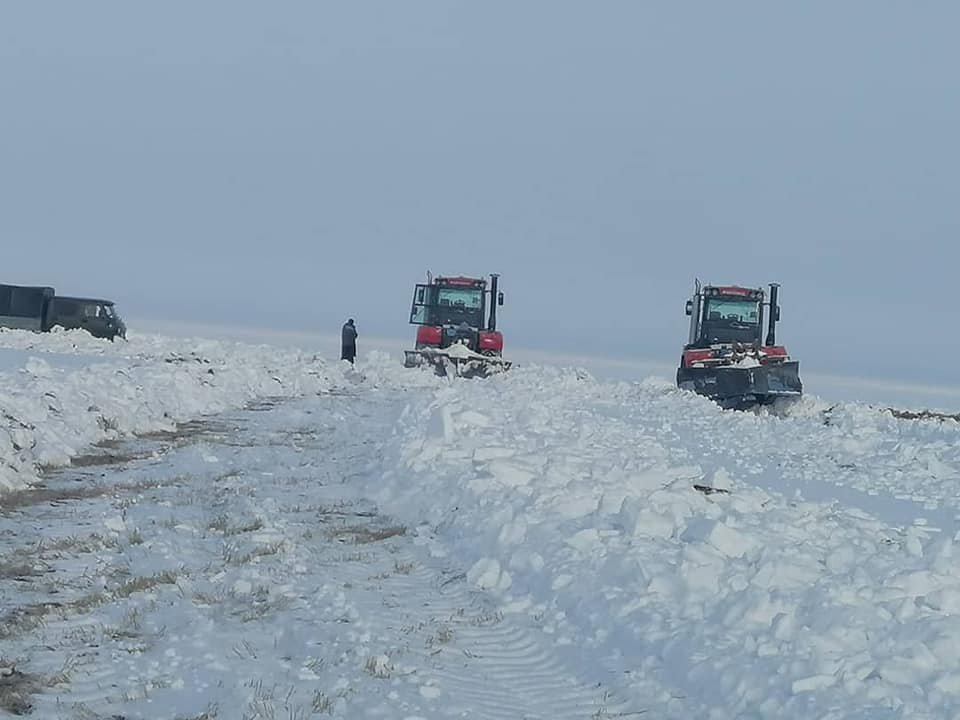
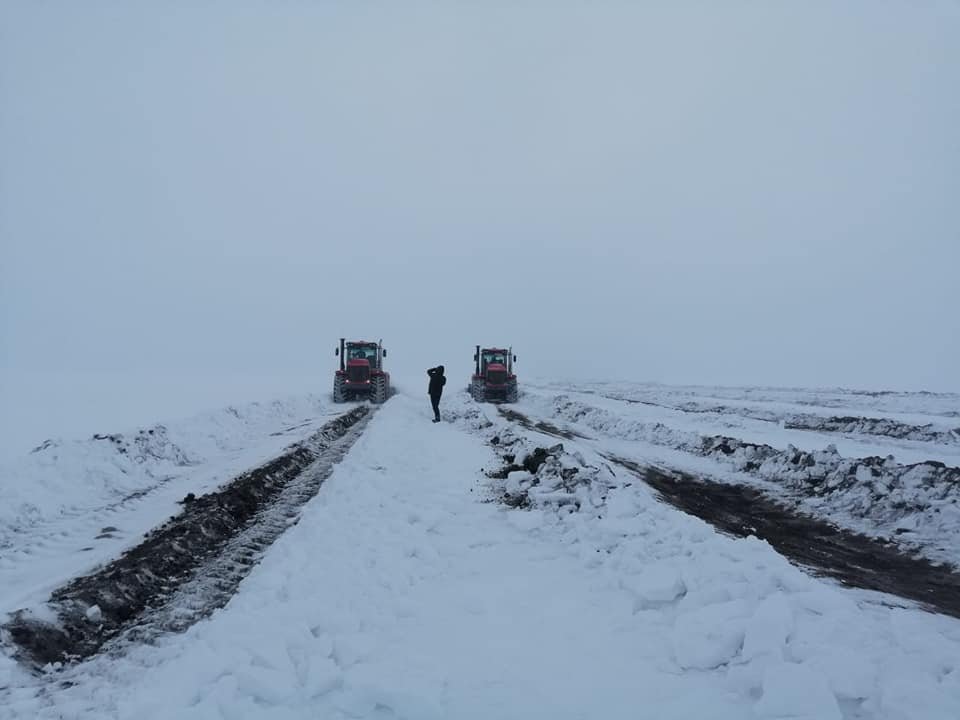
At the SPC GF named after A.I. Barayev, systematic observations of the snow cover state and the dynamics of snowmelt are carried out using means of aero- and satellite remote sensing (Figure 1-3).
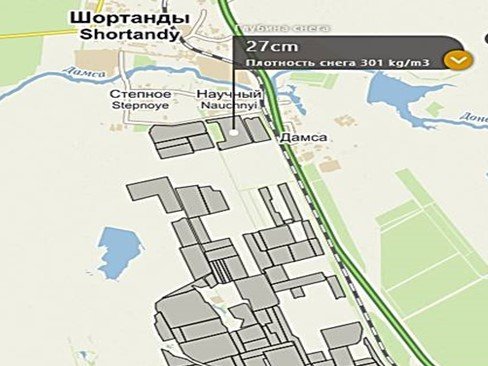
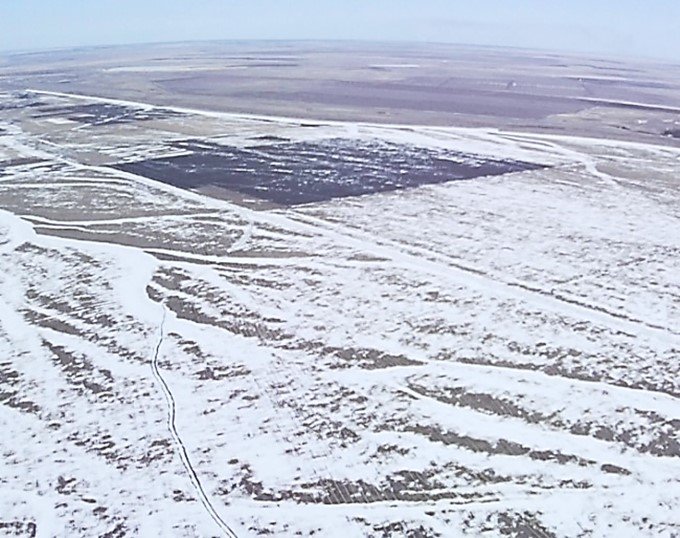 Figure 2 – Plot of farmland of SPC GF -field 10, 11- photo of the Phantom 4 UAV as on 03.04.23.
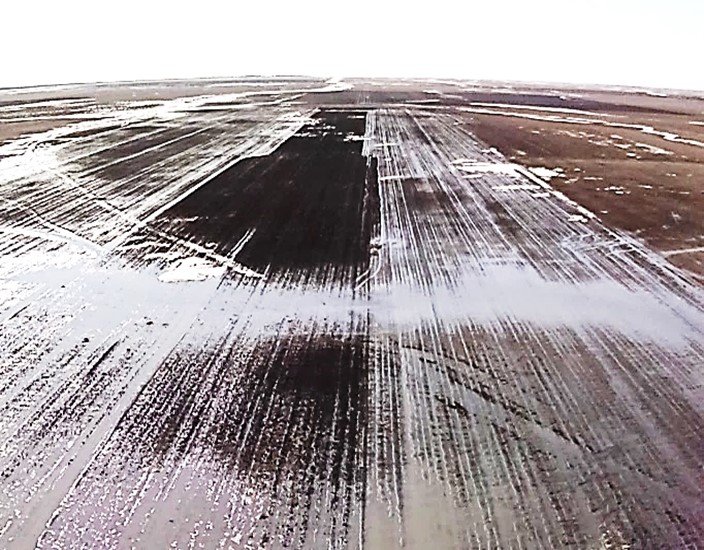 Figure 3 – The process of snowmelt and accumulation of meltwater on field 5, SPC GF,
a photo of the Phantom 4 UAV, 05.04.23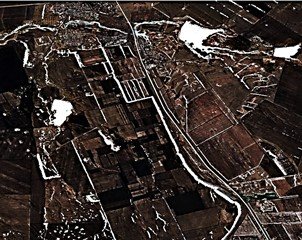
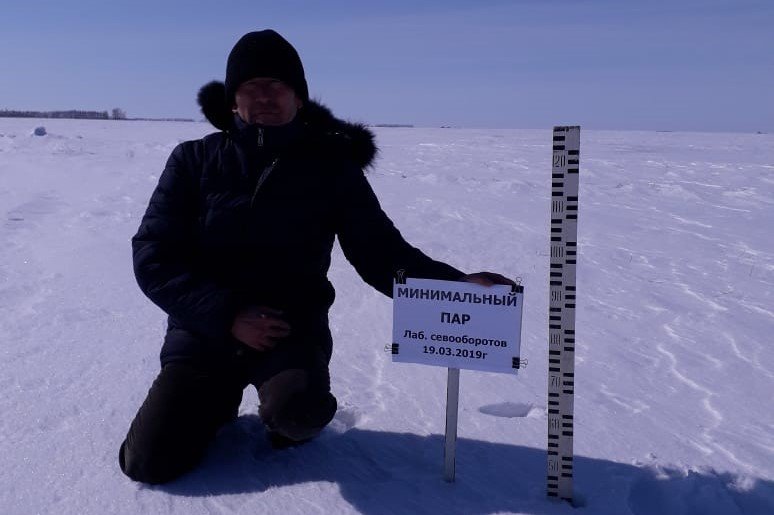
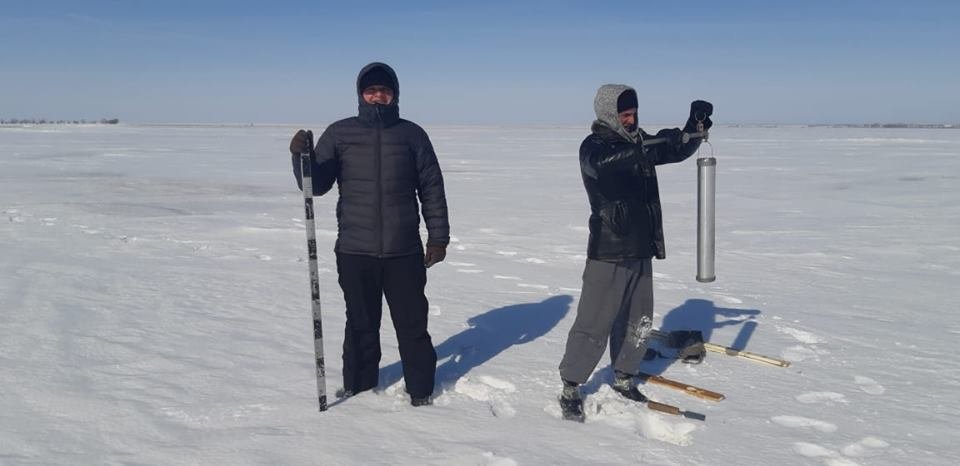
Monitoring of the dynamics of snow accumulation in 2023 showed that the maximum values of snow thickness and density were in late February – early March (Figure 1), which was more than less than in 2022.
The beginning of snowmelt occurred at the end of March-the beginning of April, unlike the previous year, when snowmelt began in the first ten days of April. The dynamics of the snow cover is shown in Figures 2 and 3. It is noted that there is a visual superiority in the preservation and retention of snow on stubble predecessors relative to fallow areas, which is associated with the rapid warming of darker arable areas and rapid melting of snow on them.
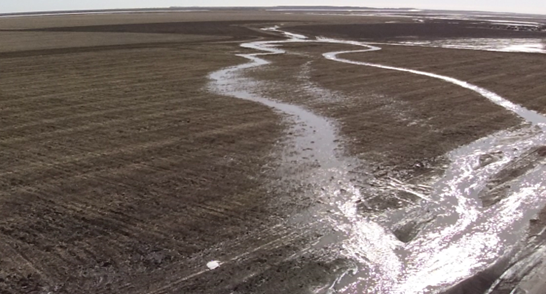
The photos taken on April 05, 2023, show an almost complete snowfall (Figure 3). It remained only in the depressions of permanent watercourses.The satellite image from 09.04.23 indicates a complete snowfall from the fields (Figure 4).
A comparison of the monitoring observations of this and last year indicates an earlier snowfall this year with a difference of 10 days.
In addition, remote monitoring of the development of water erosion processes is carried out (Figure 5, 6). Formed watercourses and planar erosion of the arable layer are noted. Based on the UAV images and the data obtained, the calculation of the losses of washed away soil, the area and volume of erosion washouts is carried out.

Figure 5 - Water erosion. Accumulation of meltwater and the formation of water flows in the fields of, SPC GF, a photo of the UAV Phantom 4, 05.04.23.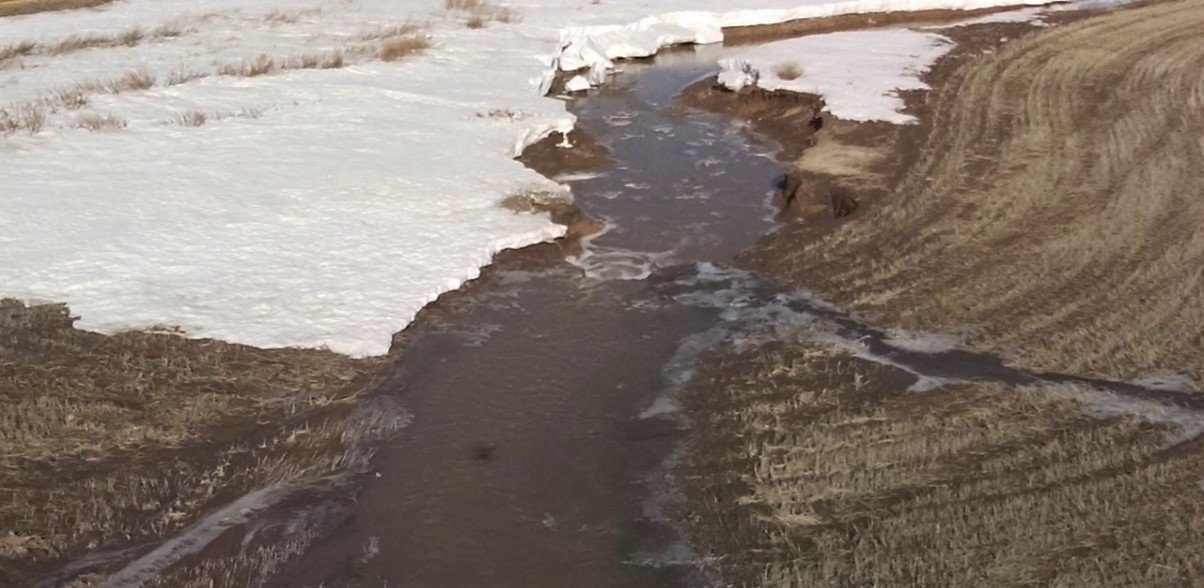
Figure 6 – Manifestations of water erosion. Formed melt water flow and soil erosion. SPC GF. The photo of the UAV Phantom 4, 05.04.23.
Authors: employees of the Precision Farming Laboratory